

Most branch managers can tell you whether yesterday felt busy. Far fewer can tell you whether their branch is efficient compared to institutions like theirs. That gap matters more every year. Roughly 8,200 community banks and credit unions now serve the U.S., down from more than 14,000 a decade ago, and the ones still growing are the ones getting more value from every branch visit (FMSI State of the Industry 2026).
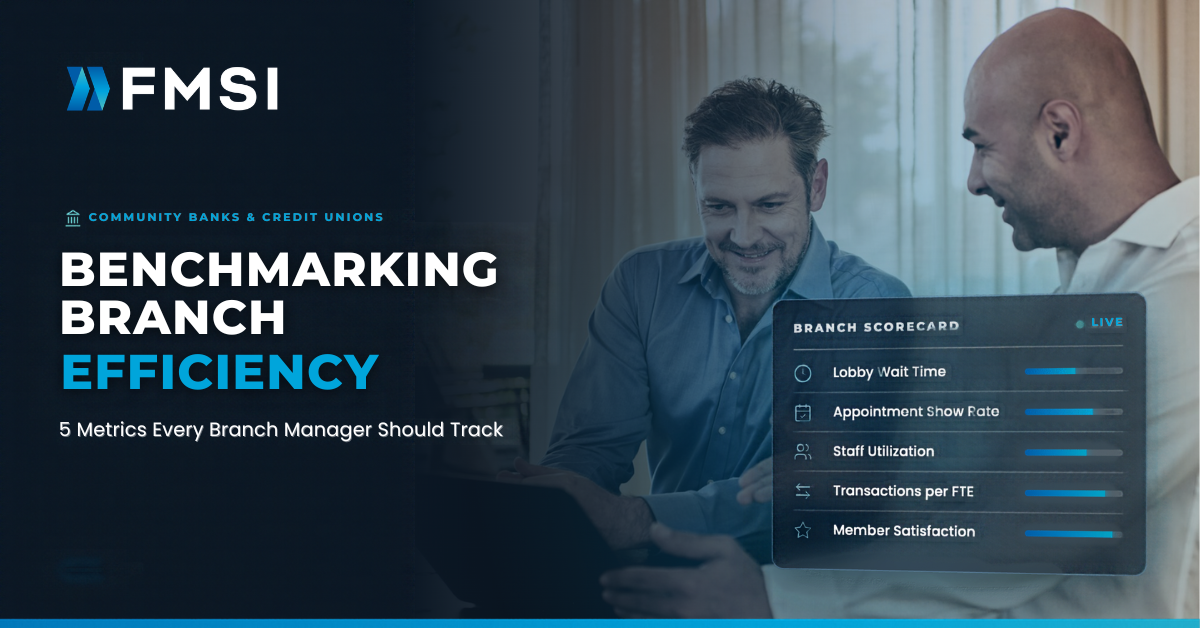
Branch efficiency comes down to a small set of measurable signals. FMSI works with more than 140 banks and credit unions, and the benchmarks below come from that network, FMSI's own branch studies, and independent industry research. Here are the five metrics that give managers the clearest picture of how a branch performs, and what good looks like for each.
What it measures: The time between a member or customer checking in and being greeted by a staff member.
Wait time is the metric members feel most directly. It shapes their impression of the visit before any conversation starts, and long waits are when people quietly walk out. That matters more as branch traffic grows: FMSI clients logged more than 7.8 million lobby visits in 2025, up about 10.5% year over year (FMSI Lobby Management).
Averages can hide the real story, so look at wait times by hour and day. A branch averaging six minutes may still have a 20-minute bottleneck every Friday at noon. Institutions that act on this data see results: FMSI reports up to a 40% wait-time reduction through data-driven improvements (FMSI Branch Analytics).
What it measures: The percentage of booked appointments that take place, the flip side of your no-show and late-cancellation rate.
Every no-show is a block of staff time that could have gone to another member, and for lending or advice conversations it's lost revenue. Institutions relying on phone booking and a basic calendar invite typically land closer to 70–80% completion. On a branch booking 40 appointments a week, the gap between 75% and 91% is six or seven lost conversations every week (FMSI blog).
The most reliable fixes are simple. Automated reminders make a measurable difference on their own: a randomized study of nearly 10,000 outpatient appointments found no-show rates fell from 23.1% with no reminder to 17.3% with an automated one (Parikh et al., American Journal of Medicine, 2010). The study was in healthcare, but the behavior carries over to any booked visit. Add easy self-service rescheduling and short booking lead times, and completion climbs further.
What it measures: The percentage of branch visits booked in advance, versus walk-ins.
This metric tells you how predictable your branch is. A higher scheduled share means managers can staff to known demand, prepare for complex conversations, and match members with the right specialist before they arrive. Across the FMSI network, clients booked more than 1.1 million appointments, and those using multi-channel booking strategies grew volume 31% (FMSI Appointment Scheduling).
The goal isn't to eliminate walk-ins. It's to make booking the easy default for visits that benefit from preparation, like account openings and loans. Triangle embedded a booking widget on its own website, and by 2025 members booked 88.5% of appointments themselves, up from 58% in 2020.
What it measures: How closely scheduled staff hours line up with actual visitor traffic, hour by hour.
Staffing is the largest controllable cost in most branches, and small mismatches add up fast. Too many people on the floor during quiet mornings is wasted payroll. Too few at the lunch rush means longer waits, rushed conversations, and burned-out staff. The pressure is rising too: 60% of financial institution leaders say talent shortages could hold back their 2026 priorities (FMSI State of the Industry 2026).
Comparing schedules to real traffic patterns, rather than habit or last year's template, lets managers move hours to where they matter. Even shifting one or two shifts a week can cut peak wait times without adding headcount.
What it measures: How often a branch visit leads to a new product or account, tracked by branch, staff member, and visit type.
This is where the first four metrics pay off. Short waits, completed appointments, predictable traffic, and the right staffing all add up to more prepared conversations, and prepared conversations open accounts. The opportunity is large: households typically hold only two to three products with their institution, and existing depositors are about 20 percentage points more likely to take a loan from the bank where they already bank (The Branch Value Gap).
Demand for that conversation is growing. J.D. Power's 2025 advice study found 26% of retail banking customers are now very interested in advice from their bank, up from 19% in 2021 (The Branch Value Gap). Tracking products opened per conversation shows which branches turn that interest into relationships, and which staffing patterns sit behind your best performers.
These five metrics work best together. Wait times rise when staffing misses traffic. No-shows waste the capacity scheduling was meant to protect. And all of it shows up in how many conversations turn into new products. Looking at them side by side shows not just what's happening, but why.
A practical way to start: pull one month of data for each metric, compare it to the benchmarks above, and pick the biggest gap to work on first. Revisit the numbers monthly so improvements stick and new issues surface early.